High-harmonic generation in solids
In this tutorial we will explore how to compute high-harmonic generation (HHG) of bulk systems from real-time TDDFT using Octopus.
Ground state calculation
As always, we will start with the input file for the ground state. In this tutorial, we will consider a 1D periodic chain of hydrogen dimers, for simplicity.
CalculationMode = gs
PeriodicDimensions = 1
ExperimentalFeatures = yes

Spacing = 0.4

%LatticeParameters
2.0*angstrom | 3.5*angstrom | 3.5*angstrom
%

PseudopotentialSet = pseudodojo_pbe

%Coordinates
"H" | -0.3707*angstrom | 0.0 | 0.0
"H" | 0.3707*angstrom | 0.0 | 0.0
%

%KPointsGrid
25 | 1 | 1
%
KPointsUseSymmetries = yes
%SymmetryBreakDir
1 | 0 | 0
%

Eigensolver = chebyshev_filter
ExtraStates = 4
Time-dependent calculation
After getting the ground state of the system, we now look into computing the HHG. In order to compute the HHG, we need to perform a real-time simulation for which we evaluate the electronic current of the system. From it, the HHG is obtained as the power spectrum of its time derivative, i.e., $$ {\rm HHG}(\omega) = \left|{\rm FT}\left(\int d\mathbf{r}\partial_t \mathbf{j}(\mathbf{r},t)\right)\right|^2 $$
In order to perform the simulation, we need to define the laser parameters. We will use here a photon frequency corresponding to $\hbar \omega = 0.75$ eV, a full duration of 4 optical cycles, with a sin-square envelope. The intensity is taken as $I=10^{10}$W.cm$^{-2}$.
The corresponding input file is given below:
CalculationMode = td
FromScratch = yes

ExperimentalFeatures = yes
PeriodicDimensions = 1

Spacing = 0.4

%LatticeParameters
2.0*angstrom | 3.5*angstrom | 3.5*angstrom
%

PseudopotentialSet = pseudodojo_pbe
%Coordinates
"H" | -0.3707*angstrom | 0.0 | 0.0
"H" | 0.3707*angstrom | 0.0 | 0.0
%

%KPointsGrid
25 | 1 | 1
%
KPointsUseSymmetries = yes
%SymmetryBreakDir
1 | 0 | 0
%

omega = 1.5*eV
period = 2*pi/omega
stime = 4*period

TDPropagationTime = stime+period
TDPropagator = exp_mid
TDExponentialMethod = lanczos
TDTimeStep = 0.1

%TDExternalFields
vector_potential | 1 | 0 | 0 | omega | "envelope_function"
%

electric_amplitude = -c/omega*(sqrt(1*10^10)/sqrt(3.509470*10^16)) # in atomic units
%TDFunctions
"envelope_function" | tdf_from_expr | "electric_amplitude*(sin(pi/stime*t))^2*(1-step(t-stime))"
%

RestartWriteInterval = 1000

%TDOutput
laser
total_current
%
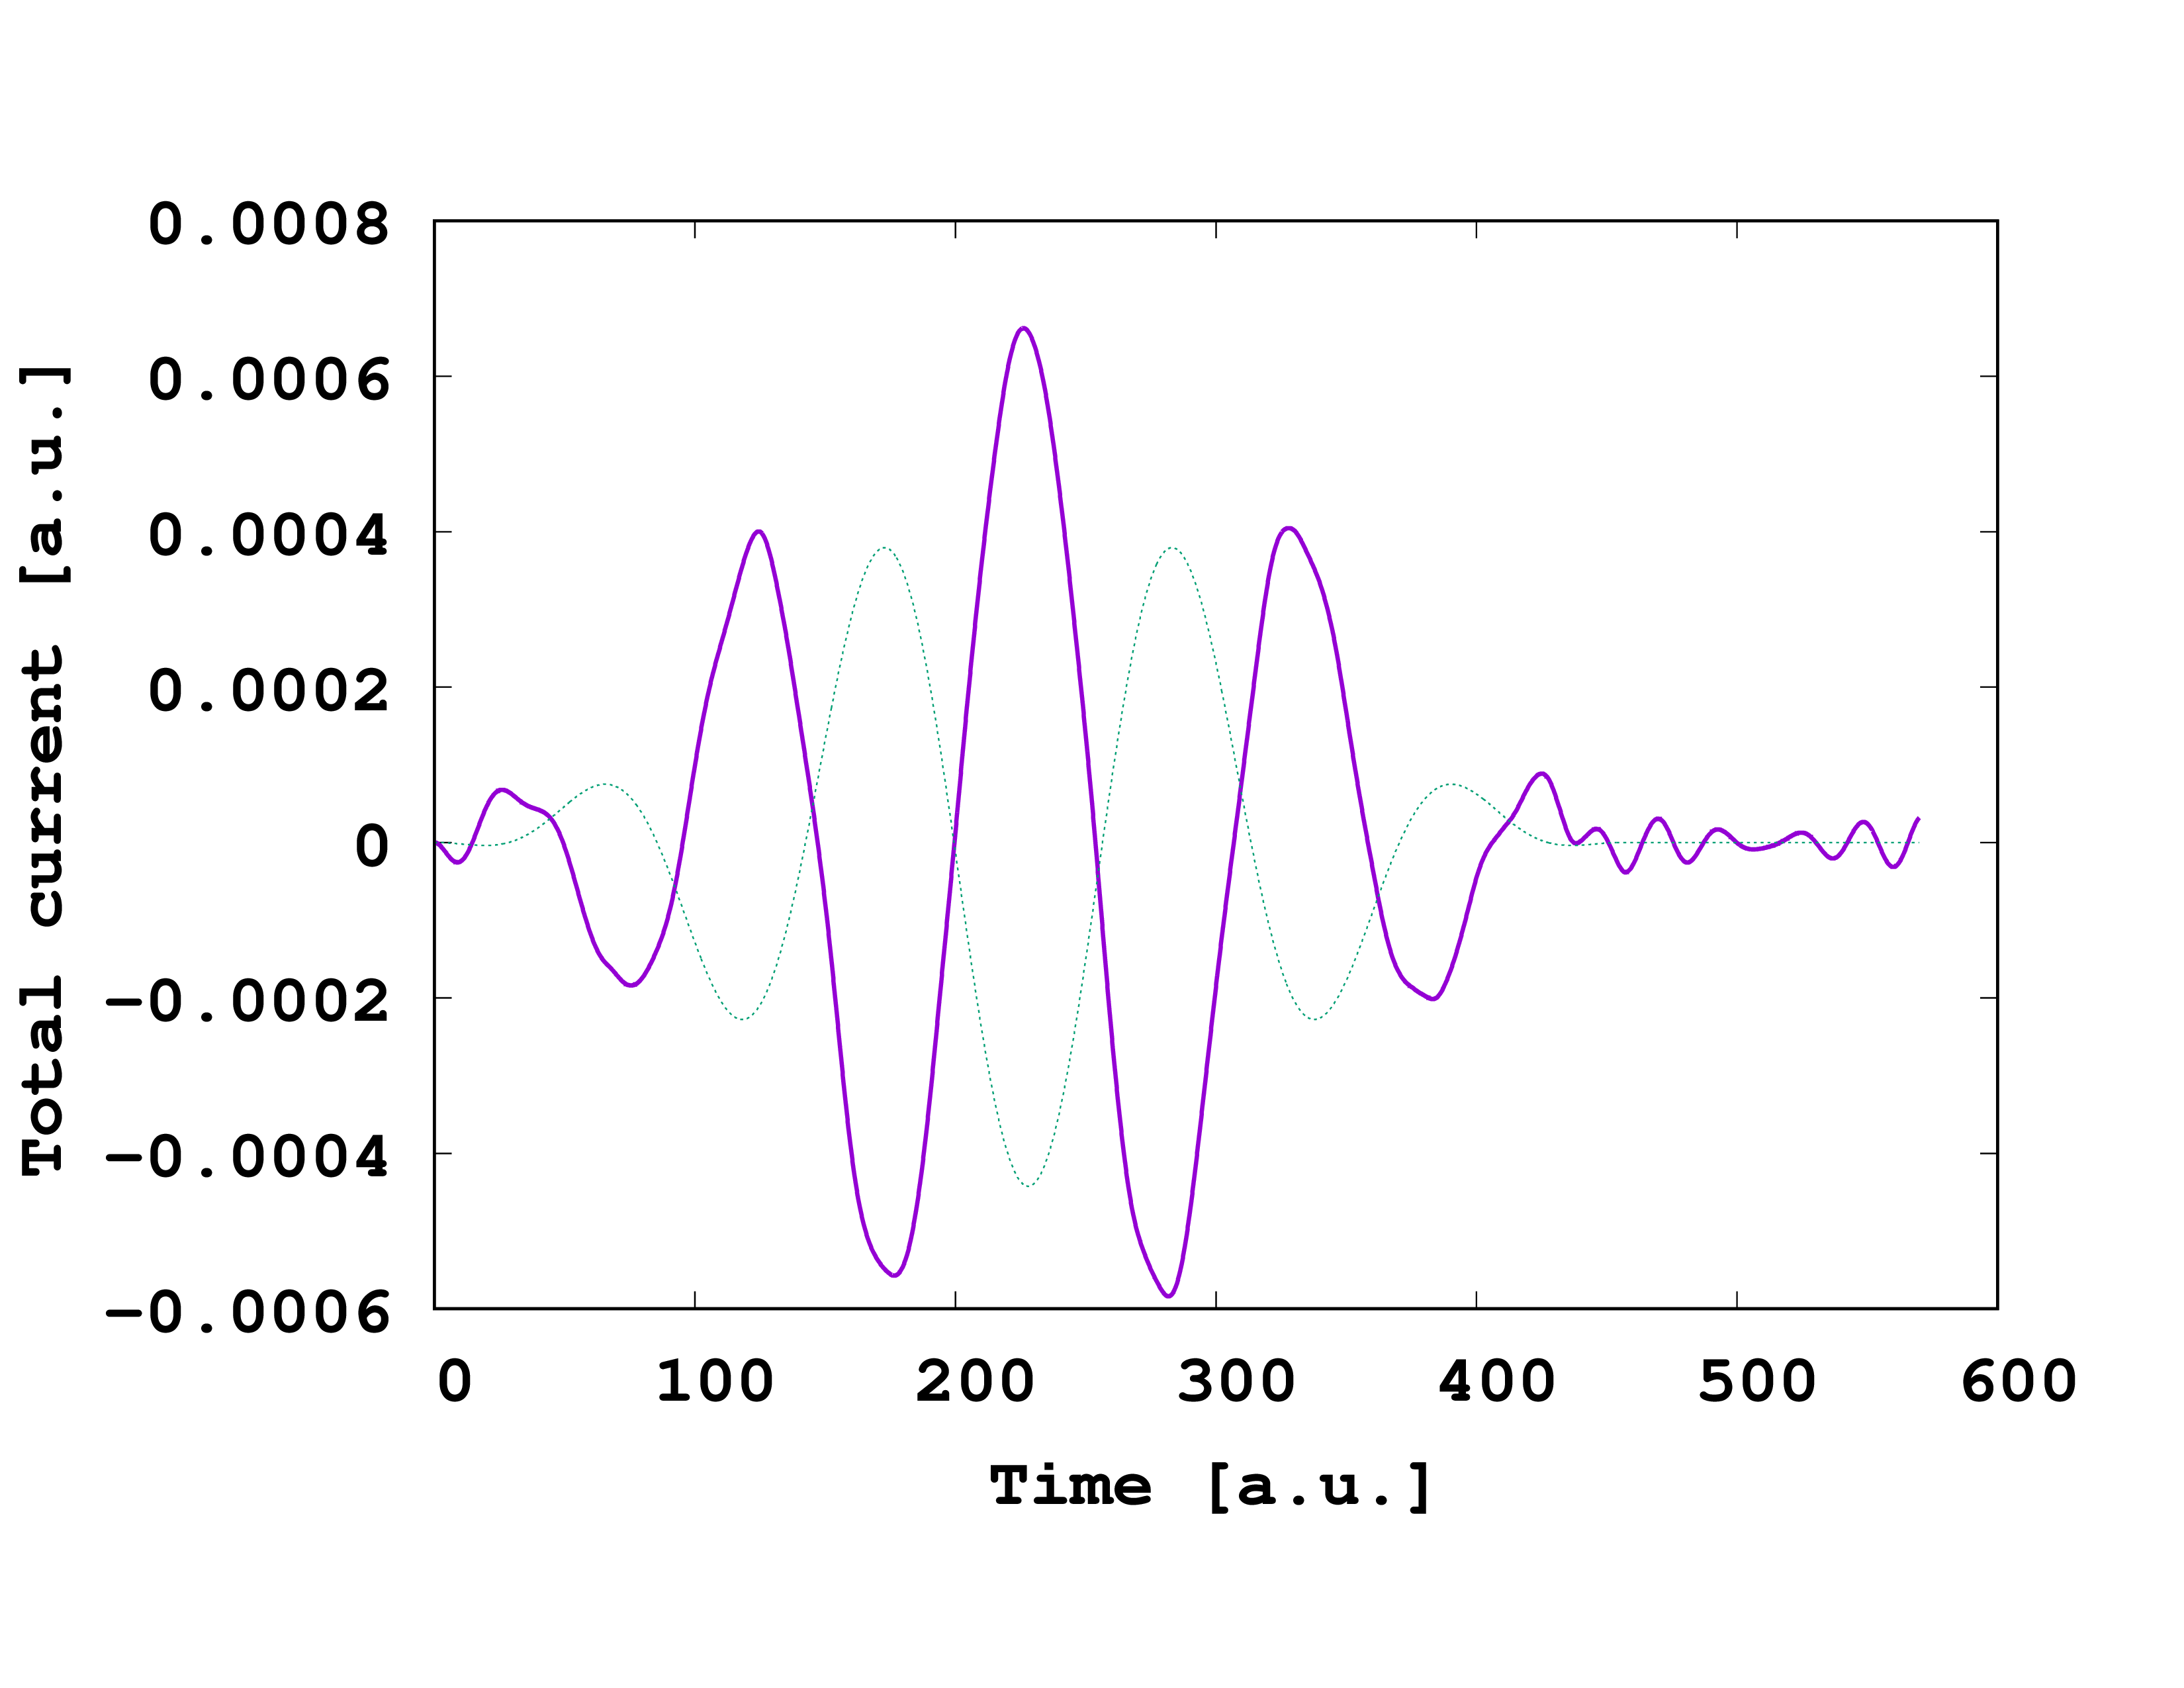
After running the simulation, one obtains the total electronic current that looks like

From this plot, it is clear that the current responds mostly linearly to the external laser field (shown by the dotted line). The small superimposed distortions and subsequent oscillations correspond to the nonlinear response to the laser field, which we are trying to resolve. In order to see this better, we now look to the harmonic spectrum of the laser field.
High-harmonic spectrum
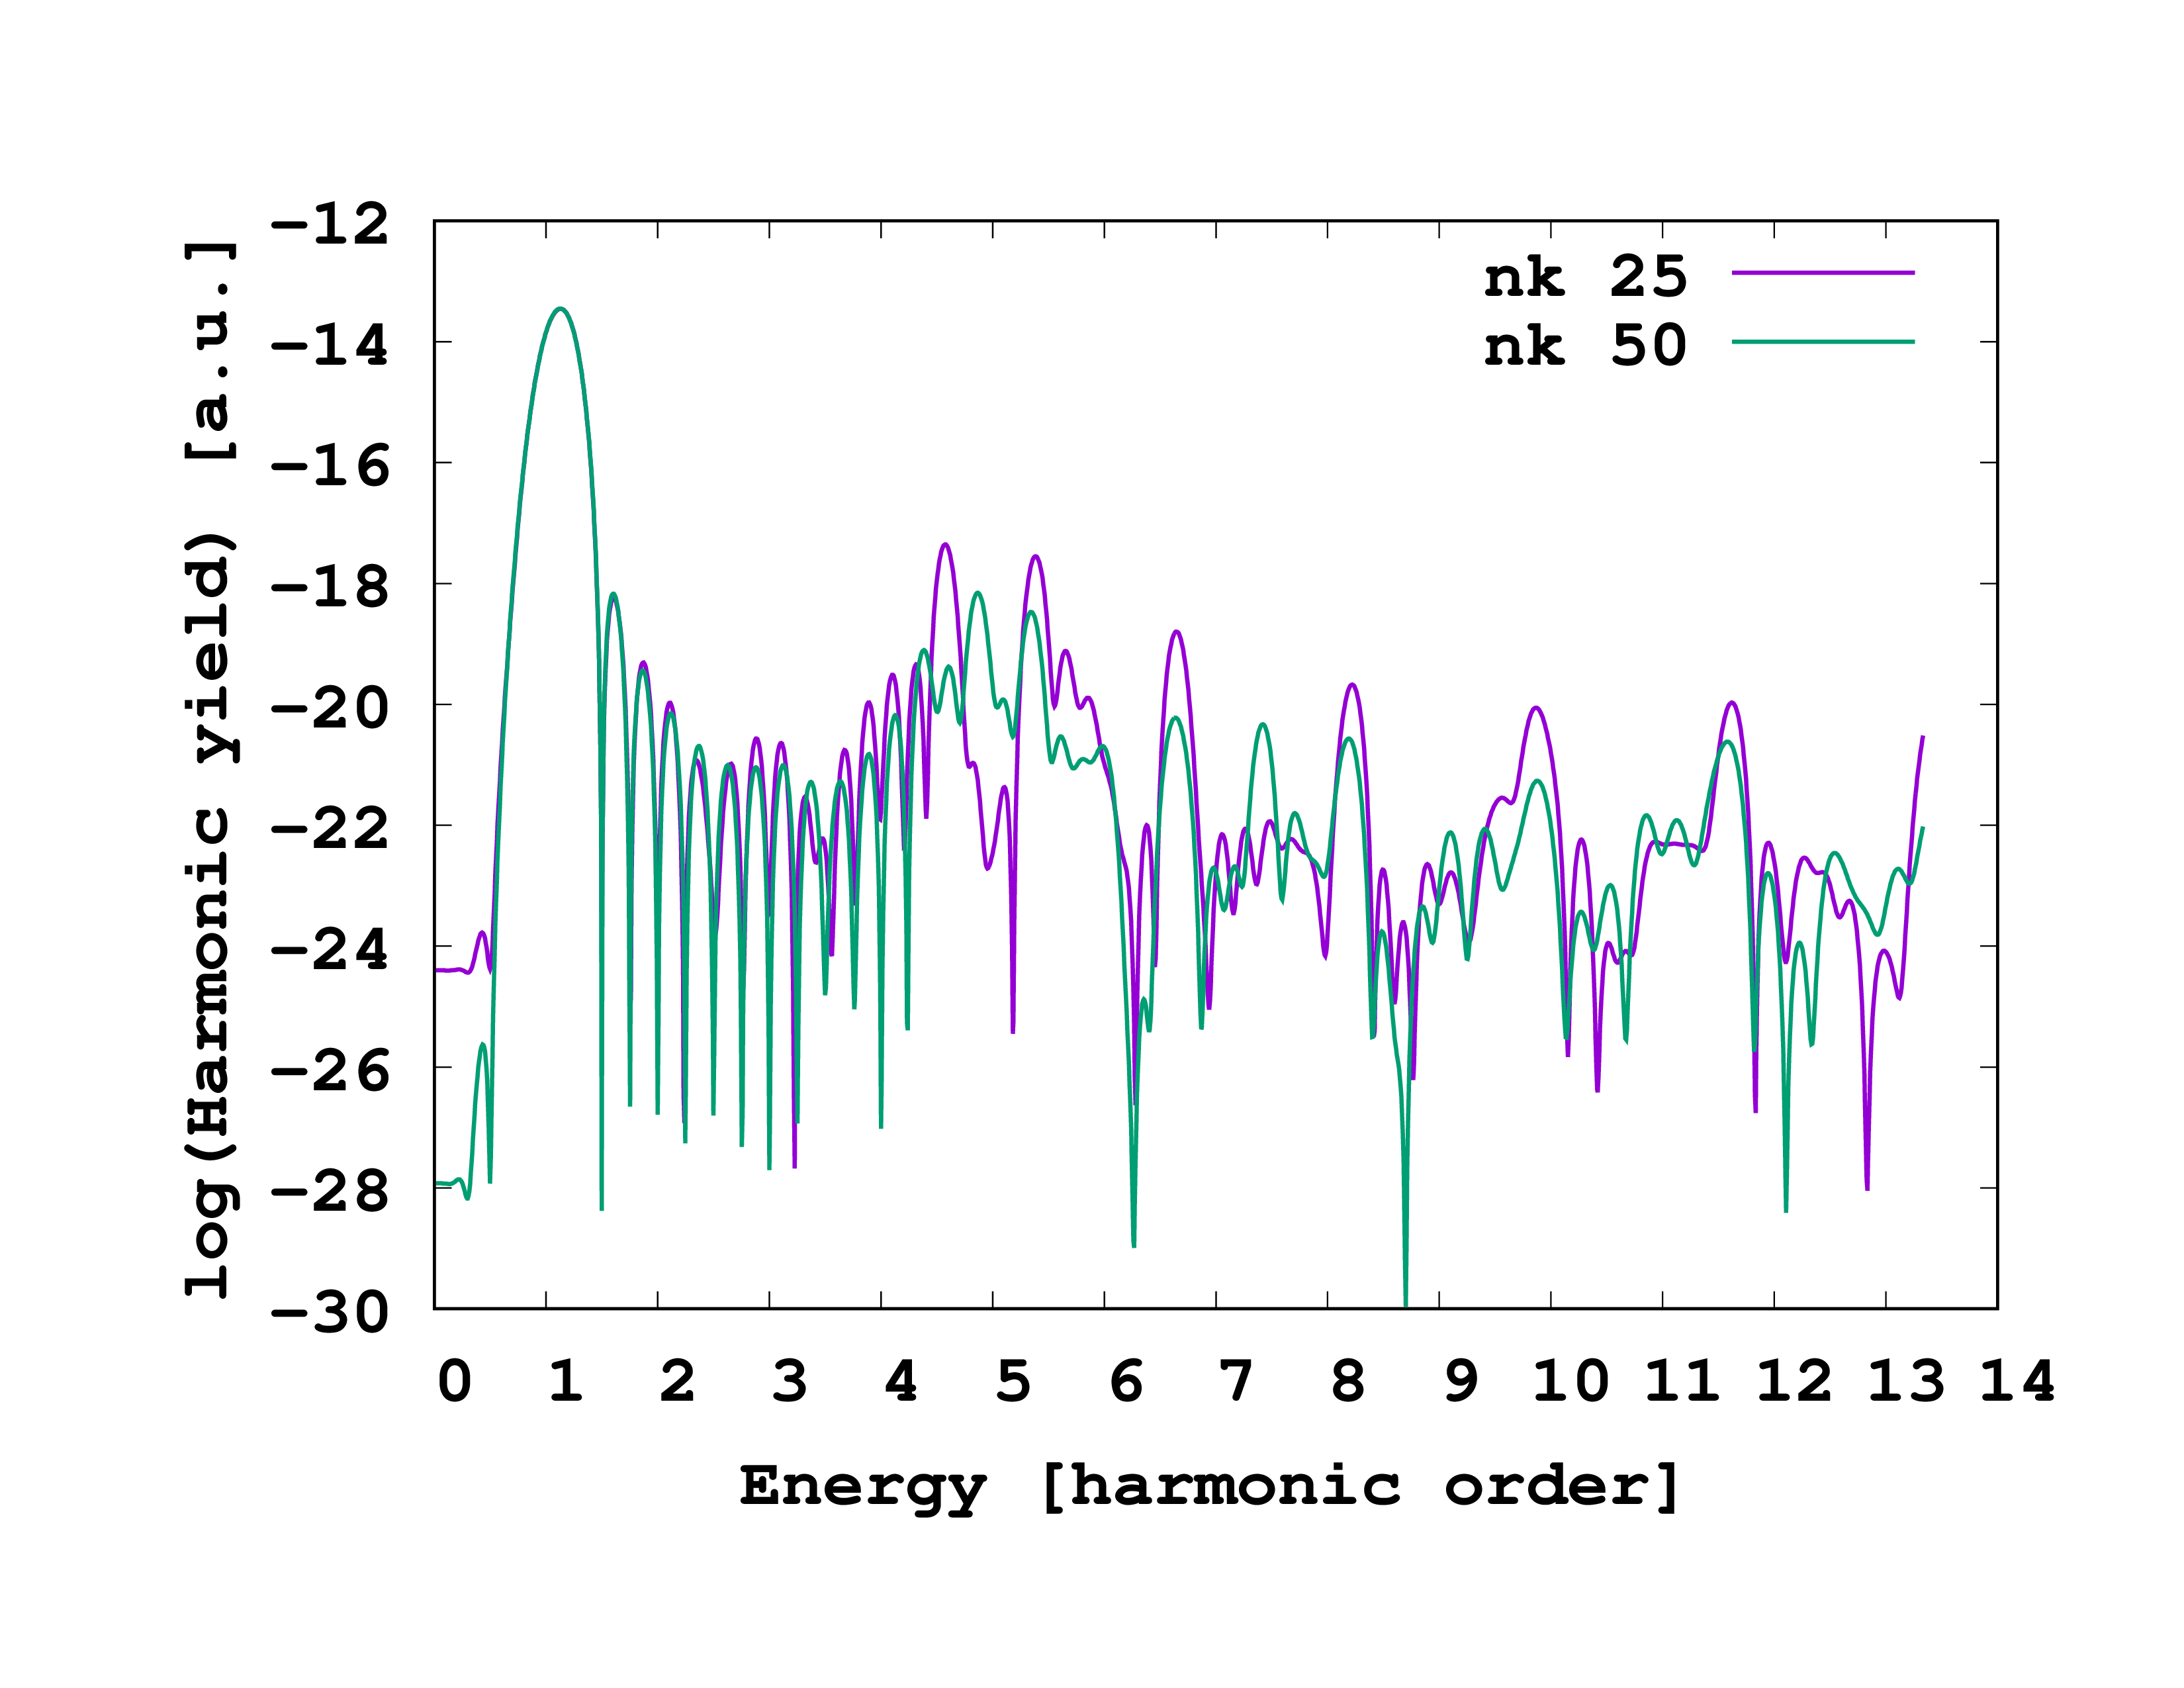
From this electronic current, one directly obtains the HHG, employing the utility “oct-harmonic_spectrum”. This produces a file called “hs-mult.x”, which, once plotted, is giving the following spectrum

As expected, we observe that the power spectrum of the current contains higher-order contributions, i.e. high-order harmonics are generated thanks to nonlinear effects. However, it is important to note that the present calculation is not converged (neither in box size in the non-periodic directions, nor in grid spacing or k-point grid) . In practical calculation, one needs to be careful with the convergence, especially with respect to the number of k-points, as the aims is to resolve tiny oscillations of the current that can be several orders of magnitude smaller than the linear response. The green curve in Fig. 2, shows the result of the same calculation but performed with 50 k-points instead of 25 k-points as done here.